Presenting Financial Performance Information
Reporting on Financial Value Realization
It’s my belief that business consulting and financial reporting should be a normal part of the core activities of the majority of if not all CSMs. I am well aware that many CSMs and their leaders would not consider it to be an important part of the CS remit. However, as more of the “easier” part of the CS role gets automated (and it will) the true value that is left is in the clever stuff – part of which is in helping customers to bridge the gap between business and technology worlds, and helping the business decision makers within the customer’s organization understand in what ways what is happening on the ground is having a real and measurable impact on their business.
This article is taken from the final video of my Engagement Evaluation module, and it’s really just a “teaser” to get CSMs thinking about how they could take the concepts shown here and incorporate them into their own customer presentations – or equally commonly, to help their primary contact within the customer organization to do so.
So anyway, here goes and I hope you enjoy it!
Financial Forecasts are in the Business Case
Of course it’s not always possible to know absolutely every detail of every cost in advance – particularly for longer lasting and more detailed business initiatives, but nevertheless, for most business cases to gain approval the costs need to be calculated as best as possible ahead of time, so that a go/no go decision can be made based upon (where possible) accurate data and (where necessary) sensible assumptions. But if you think about it, the expenditure is only half of the story, the other half of course being the income. Half of a story is as dissatisfying to a financial decision maker as it is to a child being given a bedtime story. If they want the financial decision makers to be happy, the person or group of people who are writing the business case need to give them the whole story, not just half of it.
The other half of the equation is the financial value that is (or will be) returned by the initiative. Sometimes this is easy to calculate. For example, let’s say that the initiative is an advertising campaign that is similar to other advertising campaigns that have previously been run, and as such a similar level of performance is expected to be attained from this campaign compared to those previous campaigns. Maybe the company can produce a simple cash flow spreadsheet to show both when the (probably known for certain in advance) costs occur and how much they are, together with when the (not known for certain but anticipated based upon previous performance) revenue increases from additional sales will likely occur and how much they will be. It might look something like this:
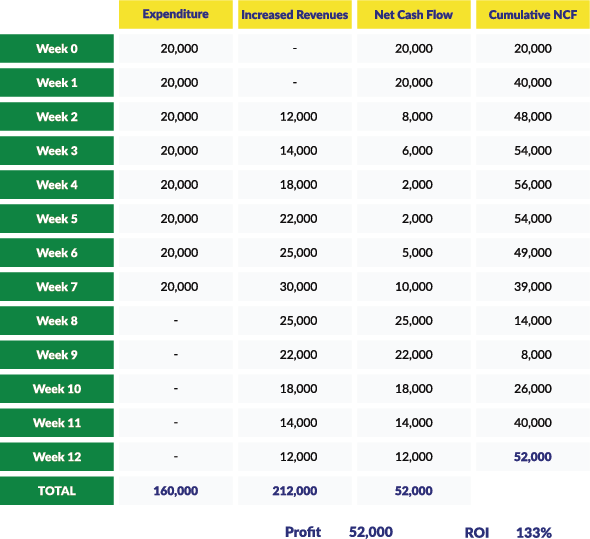
In this simple cash flow we see the costs and the increased revenues for each week of the campaign shown in columns B and C respectively. Then we see the net of these two columns (ie revenues minus expenditures) for each week shown in column D and the cumulative net cash flow (ie each new week’s net cash flow added to the previous amount to get a running total) in column E.
Simple math shows us that (always assuming these figures are sufficiently accurate), the amount of profit returned by the proposed advertising campaign is going to be around 52,000, which can also be shown as an ROI of 133% (which is income divided by expenditure and then expressed as a percentage).* Of course as with most projected future figures, the actual values that occur will differ somewhat. Investment decision makers will know this, and may want to know what the level of accuracy is and how you have determined this. So for example, maybe the analysts who created the business case consider the increased revenues to be accurate to within plus or minus 10%, and (as we have already said) they have based their revenue figures upon the results of previous similar advertising campaigns. Generally of course all or at least most of the larger costs associated with an initiative are known in advance since estimates and/or quotations for capital and ongoing expenditures will already have been researched.
*Note that many analysts will more properly calculate and show the ROI as being 33% rather than 133%, however unless I am presenting to financial experts, I prefer to show it as 133% since if you think about it, what has been returned by the investment is indeed 100% of the investment plus another 33%. You may want to check what your customer’s stakeholders do when they calculate ROI and then perform your calculations accordingly.
Of course this is just a very simple cash flow model. It doesn’t for example allow for any reductions in the future value of money compared to the value of money right now, which is what a discounted cash flow would do, showing net present values rather than simple cash flow values, but that’s an advanced financial modelling technique that is well beyond where we will get to in this short article.
Building on the Estimates to Show Real Returns
The cash flow we have looked at here may have been created at the start of the initiative, or even during the development of the business case prior to the initiative being approved. How the CSM can use a simple cash flow like this in their regular reporting on progress with customer stakeholders is to create additional columns for “actual” values to display alongside the “estimated” ones, which might by the end of week 7 look like this:
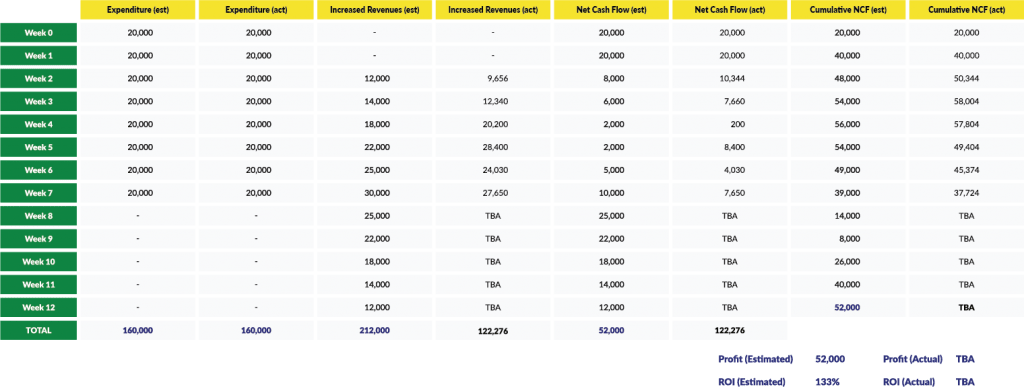
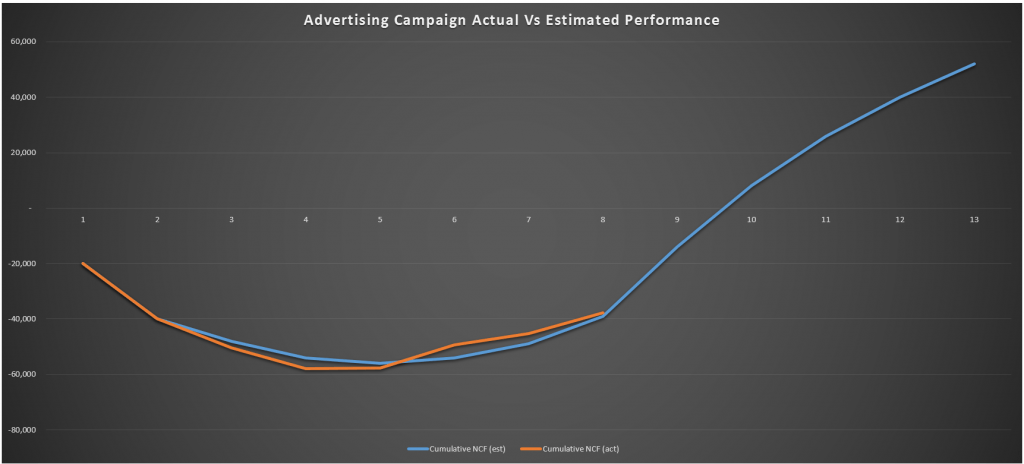
Of course at this halfway-ish stage in the initiative, the final results are not in and so the actual profit and ROI from the initiative cannot yet be calculated. But at this stage, what customer stakeholders will want to know is “are we on track to hit our targets?” and in this instance the answer is “yes”. This could probably be made much clearer to them by creating a chart that because of its visual format, makes the analysis of the information much easier for stakeholders to understand what is happening, which could for example look like this:
Just to complete the sequence for you, by the end of the period, the cash flow and chart might look as follows:
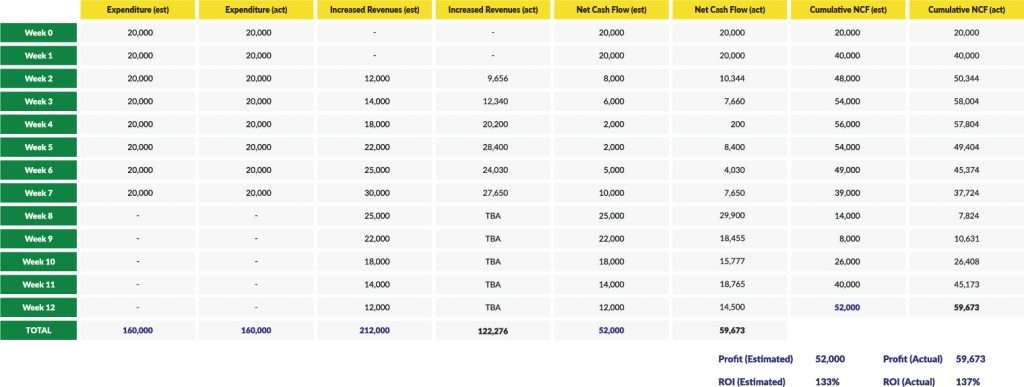
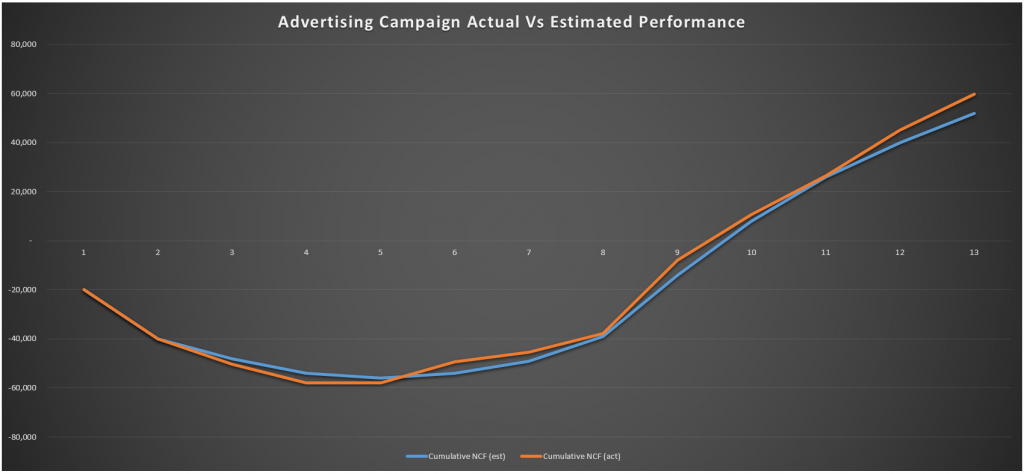
The combination of both estimated and actual data in the cash flow spreadsheet and the additional graphical representation of the data in the chart provides excellent information to include within the regular reports that the CSM creates and presents (or is involved in creating and presenting) to customer stakeholders. Stakeholders who are responsible for budgets and for financial decision making are much more easily reassured when they see the data shown in this sort of format, and the results can of course be discussed and where necessary any corrective actions to get the initiative back on track can be agreed, using the data as the start point for these discussions.
Summary
The CSM’s role is all about value and specifically about value from the perspective of the customer. A large part of the value that the customer’s business decision-makers need to see is financial value. Using cash flows and charts to show the financial information is very powerful, and incorporating estimated data that was developed at the pre-sales stage with actual figures that are being collected on a regular basis as the initiative moves forwards makes it even more powerful. In this short article, we have looked at how CSMs can create meaningful reports for showing the financial returns from the initiative. Of course, this is not the only use of charts and spreadsheets, and in another article, we’ll look at another example that focuses less on money and more on outcome attainment. In other articles, we might look at how the CSM might go about helping the customer to calculate the financial returns from the initiative, based upon calculating both direct and indirect benefits. Please let me know if that would be interesting to you, and in any case, all this and much much more can be found in the Certified CSM Professional self-study training program that we will be launching very shortly!

